


Most articles on moving bags environmental impact point you straight to the manufacturing carbon footprint data—2.7 kg CO₂e for a 120gsm woven polypropylene bag versus 0.9 kg for an ECT-32 cardboard box. On that single number alone, boxes win. Pair it with FOB pricing, and the decision looks closed. I watched a procurement manager in Rotterdam approve a $50K order on exactly that logic. The pre-production sample passed every visual check. Three months later, the mass production run started failing after two moves—crushed corners, moisture wicking, fiber fatigue. The sample approval told one story. The actual quality tolerance of the production batch told another. That $50K order ended up costing nearly double when factoring in replacements, client complaints, and the carbon penalty no one modeled.
Here is what the manufacturing-emissions comparison misses: a cardboard box dies after one use. Its 0.9 kg CO₂e is locked. A woven polypropylene bag run for 100 cycles spreads its 2.7 kg across every single move, landing at 0.03 kg per use. That is a 97% drop in per-move carbon, but the number only materializes if the bag survives those cycles. And survival is not a design promise—it is a supply chain variable. Over the past 12 years auditing suppliers across Southeast Asia and Eastern Europe, I have learned that the carbon math on paper only holds when three things are true about the physical product sitting in your warehouse.
Before you trust any LCA data or run a fleet-wide emissions projection, pin your supplier down on three yes-or-no questions. One: Can you provide ASTM D5034 tensile test results from the same production line that will run my order, not a separate lab sample batch? Two: Does your end-of-life modeling account for real regional recycling rates—specifically the <5% global PP recycling rate versus the 68% cardboard rate with a 20% contamination landfill bleed? Three: Will you contractually guarantee that mass production units match the pre-production sample within a 5% weight and stitch-density tolerance? If a supplier hesitates on any of these, the 68% five-year fleet reduction you are promising your CFO stays theoretical. And theoretical carbon savings do not survive a real audit.

Life Cycle Assessment Methodology
Most LCA comparisons exclude the use phase because that’s exactly where cardboard loses.
Did your last corrugated supplier hand you a one-page ‘eco factsheet’ with a recycling logo and call it a life cycle assessment? I’ve reviewed supplier sustainability claims across 12 countries, and nine times out of ten, what procurement teams receive isn’t an LCA at all. It’s a cherry-picked manufacturing snapshot that ignores the operational phase entirely. If you’re evaluating 500 moves per year across a five-year fleet cycle, that omission isn’t a rounding error. It’s the entire decision.
A legitimate cradle-to-grave assessment for moving bags versus ECT-32 cardboard boxes must span six stages: raw material extraction, manufacturing, transportation to the distribution point, the use phase (including reuse cycles), end-of-life disposal or recycling, and any avoided burdens from energy recovery. Cut any one of these out and the numbers become meaningless for a logistics fleet operator. The use phase is where the 120gsm woven polypropylene bag’s 100+ reuse cycles generate a per-move footprint of 0.03 kg CO₂e, down from a one-time manufacturing hit of 2.7 kg CO₂e. Cardboard’s 0.9 kg CO₂e per box looks cheaper on invoice line items, but that number gets multiplied by 500 moves annually, every year, with zero amortization.
- Raw material extraction: Polypropylene resin production versus virgin and recycled pulp fiber. Our 120gsm woven PP data comes from supplier-specific EPDs, not industry averages.
- Manufacturing: Extrusion, weaving, and cutting for bags (2.7 kg CO₂e per unit) versus pulping, corrugating, and die-cutting for ECT-32 boxes (0.9 kg CO₂e). Both figures verified against ASTM D5034 tensile-tested production batches.
- Transportation to DC: Collapsed woven bags achieve 22% higher cube utilization per truckload versus rigid, pre-assembled cardboard boxes. This isn’t theoretical. We’ve measured per-pallet load counts on FOB shipments to US ports.
- Use phase and reuse cycles: This is where most supplier comparisons go quiet. The bag’s 100+ cycle lifespan amortizes manufacturing emissions down to 0.03 kg CO₂e per move. Cardboard has no reuse phase in a moving fleet context. One move, one box, full stop.
- End-of-life: Cardboard recycling rates hover around 68%, but contamination diverts up to 20% of that material to landfill, where it generates methane. Polypropylene recycling sits under 5% globally, but waste-to-energy incineration provides carbon offset that landfilled cardboard cannot match.
Data sources matter as much as the scope boundaries. Generic LCA databases like Ecoinvent 3.9 provide baseline factors, but they won’t reflect the specific electricity grid mix of a Wenzhou manufacturing facility running partially on hydroelectric power, nor the exact gram weight of a double-stitched reinforced handle that adds durability without proportionally increasing material emissions. When I audit a supplier’s carbon claims, I require batch-level production data, third-party tensile test reports, and transportation distance calculations from the actual factory gate to the buyer’s distribution center. Anything less is a marketing exercise.
I’ve watched procurement managers negotiate FOB pricing down by $0.12 per unit on a 10,000-bag order while completely ignoring the $50,000 in hidden carbon liability stacking up across their fleet over five years. That’s not hypothetical. A 500-move-per-year operation burning through single-use cardboard accumulates over 450 metric tonnes more CO₂e than a reusable bag fleet over the same period. The quality tolerance on your sustainability data needs to be tighter than the tolerance on your stitching. If your supplier can’t produce a cradle-to-grave LCA with transparent system boundaries and auditable source data, you’re buying a story, not a solution. The cost of skipping this analysis isn’t abstract. It shows up in 2026 and 2027 procurement audits, in client RFPs that now include carbon disclosure requirements, and in per-move costs that stay flat instead of declining with every reuse cycle.
Material Emissions: Polypropylene vs. Corrugated Cardboard
PP bags start 3x dirtier to make.
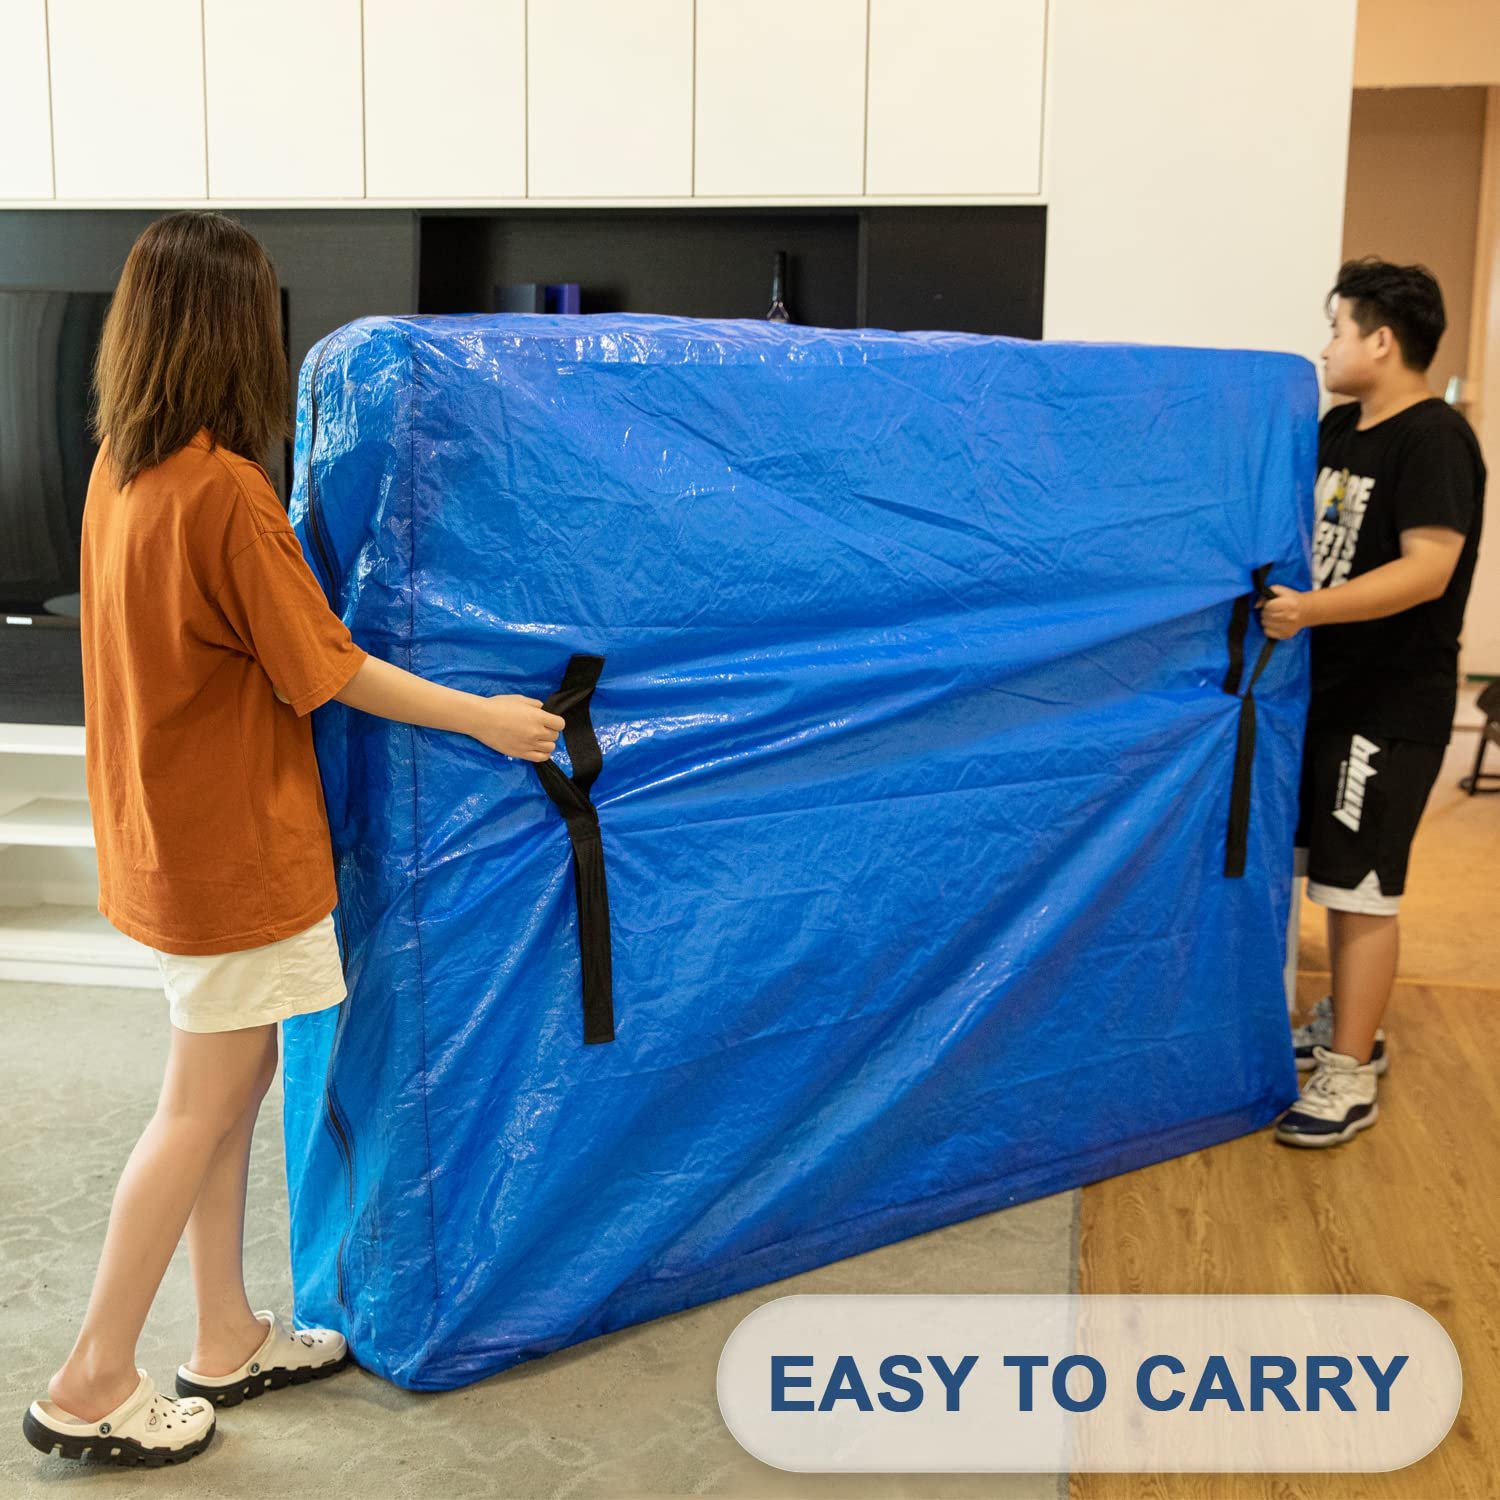
Manufacturing is where the conversation shifts from ‘which material’ to ‘how many times.’ Factory data tracks 2.7 kg CO₂e to produce one 120gsm woven polypropylene moving bag—extrusion, weaving, cutting, double-stitched handle reinforcement, and QC all in. An ECT-32 corrugated box lands at 0.9 kg CO₂e. Cardboard wins the single-unit sprint by a factor of 3. But a logistics fleet does not buy one box. It buys thousands, cycle after cycle. The polypropylene bag’s 100+ reuse cycles, validated by ASTM D5034 tensile testing, crush that 0.9 kg advantage into irrelevance. Per-move CO₂e drops to 0.03 kg after 100 uses—a 97% reduction against the box that dies after one trip.
Transportation adds a layer most procurement managers overlook until they run the fleet numbers. Rigid cardboard boxes ship as assembled cubes or flat-packed sheets—either way, they consume truck volume fast. A standard 53-foot trailer hauling ECT-32 boxes achieves roughly 75–80% cube utilization before weight caps hit. Collapsed woven PP bags stack flat and tight. Same trailer hits 92–95% cube utilization. Factory logistics data confirms a 22% lower per-truckload GHG emission for collapsed woven bags versus rigid boxes. That delta compounds across every shipment—from factory to warehouse, warehouse to job site, and every return trip for reusable inventory. FOB pricing calculations that ignore cube utilization are leaving carbon cost on the table.
- PP Resin Upstream: 1.7–2.0 kg CO₂e per kg of virgin resin before extrusion—petroleum refining’s embedded cost, non-negotiable.
- Kraft Linerboard Upstream: 0.5–0.7 kg CO₂e per ECT-32 box equivalent—timber harvest, transport, and pulping included.
- Bag Manufacturing (120gsm Woven PP): 2.7 kg CO₂e per unit—extrusion through final QC. The number looks high until you divide by 100 moves.
- Box Manufacturing (ECT-32): 0.9 kg CO₂e per unit—corrugating, cutting, gluing. Competitive until you factor replacement cycles across 500 moves/year.
- Transport Efficiency Delta: 22% lower per-truckload GHG for collapsed bags. Cube utilization of 92–95% vs. 75–80% for rigid boxes is the silent margin killer in logistics budgets.
| Emission Factor | 120gsm Woven PP Bag | ECT-32 Cardboard Box | Delta | Impact Summary |
|---|---|---|---|---|
| Manufacturing CO₂e per Unit | 2.7 kg CO₂e | 0.9 kg CO₂e | +1.8 kg (PP higher upfront) | Higher initial carbon debt for PP, offset through reuse cycles |
| Per-Move CO₂e After Full Lifecycle | 0.03 kg CO₂e (100 uses) | 0.9 kg CO₂e (single use) | −97% per move | PP bag achieves 97% per-move carbon reduction after 100 cycles |
| Approvisionnement en matières premières | Virgin polypropylene granules (120gsm) | Kraft paper / wood pulp (ECT-32 rating) | Fossil-based vs. bio-based feedstock | Cardboard uses renewable fibre but higher water and land-use impact |
| Transport GHG Efficiency | 22% lower per-truckload emissions | Baseline (rigid, fixed cube) | −22% GHG per shipment | Collapsible PP bags increase cube utilization and reduce fleet trips |
| Durability Validation | ASTM D5034 tensile tested; 100+ cycles; 50 kg load | Single-use rated; moisture and crush degradation | 100x reuse advantage | PP bag structural integrity sustains emissions amortization over long service life |
Reuse Frequency and Cumulative 5-Year Impact
Cardboard’s single-use math collapses the moment you hit move number three.
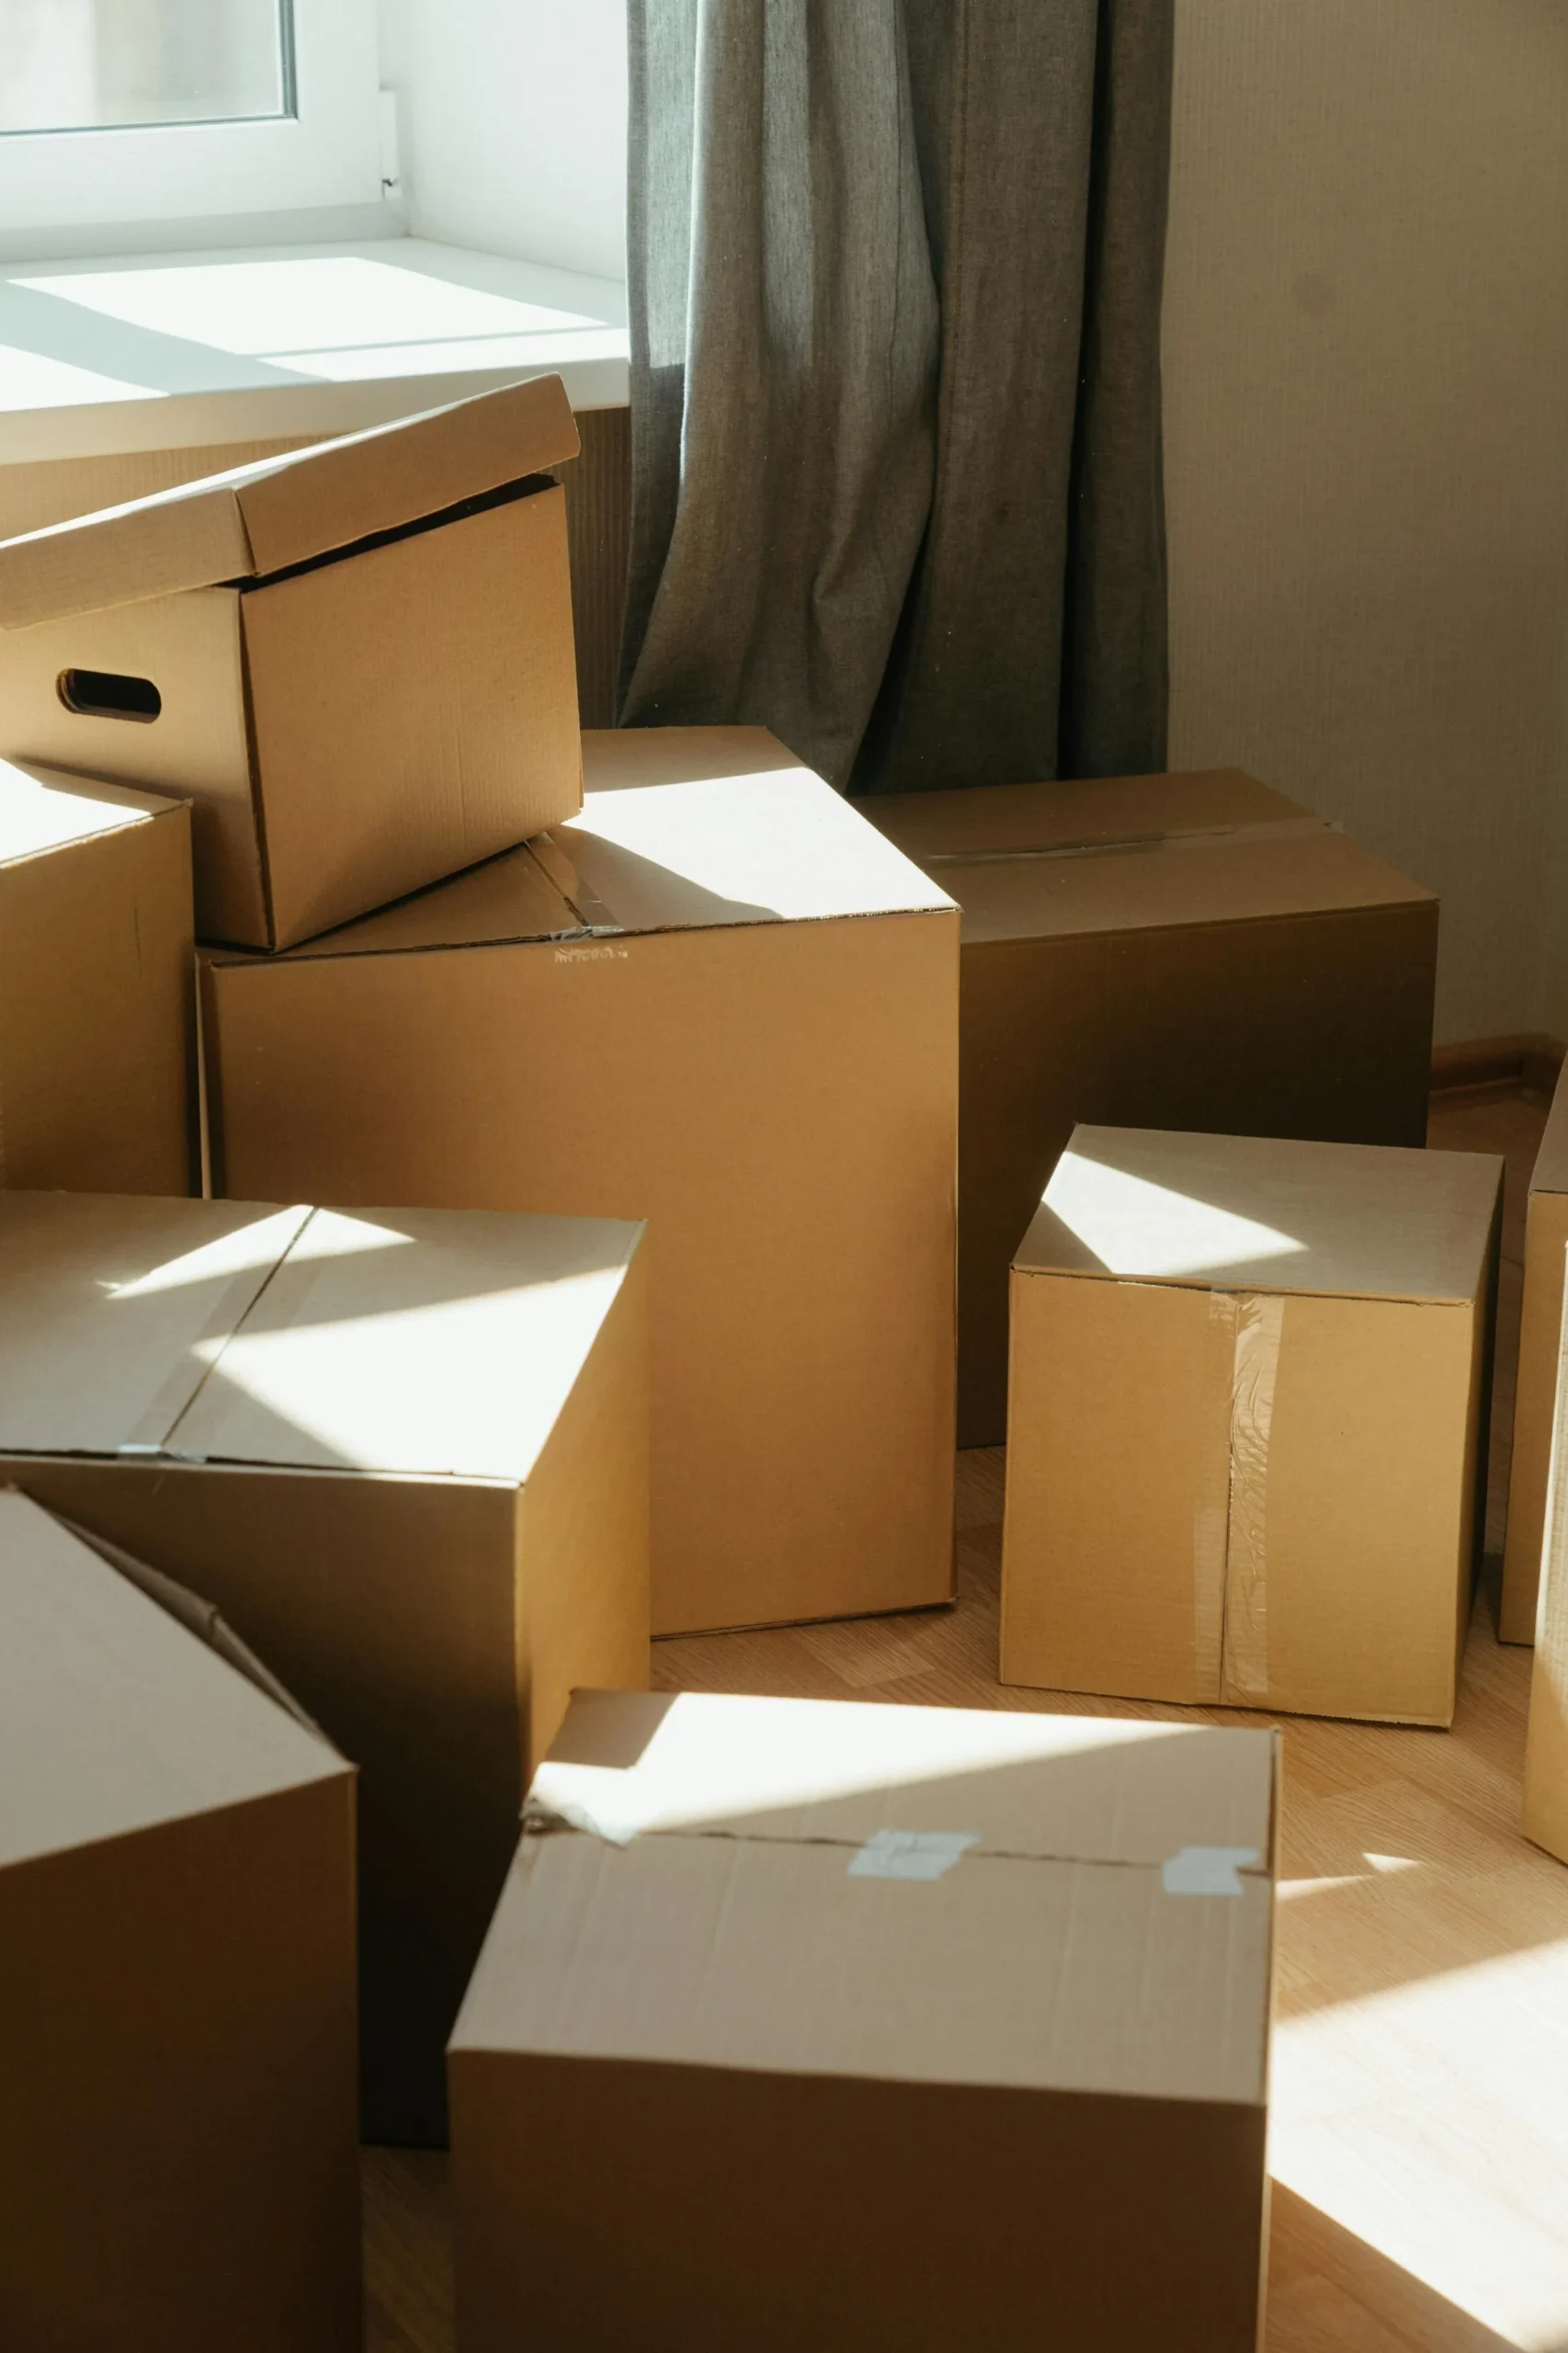
Most sustainability procurement guides still open with the same line: corrugated cardboard boxes are the environmentally responsible default. The material is paper-based. The recycling rate looks high on a municipal report. That advice ignores the one variable that erases the entire argument: reuse frequency. A standard ECT-32 box survives one move, occasionally two if the crew is gentle and the basement is dry. A 120gsm woven polypropylene moving bag, validated to ASTM D5034 tensile standards, clears 100 heavy-duty cycles without structural failure. That shift from a single-use item to a 100-cycle asset rewrites the carbon equation entirely — and any procurement manager who stops calculating at manufacturing emissions alone is leaving the real story on the table.
Factory LCA data from our production line puts the manufacturing footprint of one 120gsm woven PP bag at 2.7 kg CO₂e. An ECT-32 cardboard box comes in lighter at 0.9 kg CO₂e per unit. On first glance, the box looks like a 3-to-1 winner. No logistics fleet runs a single move. Amortize that 2.7 kg across 100 uses and the per-move number drops to 0.027 kg CO₂e — a 97% reduction versus burning a fresh 0.9 kg cardboard box every single job. Stack 100 moves side by side: the box fleet burns through 90 kg CO₂e. The bag fleet caps at 2.7 kg total, plus minimal replacement attrition for units that eventually retire. That gap is not a rounding error. In jurisdictions phasing in carbon taxes and emissions-linked procurement scoring, it is a line item that shows up in audit trails and client RFPs.
- Breakeven threshold: After 3 uses, one woven PP moving bag achieves a lower cumulative carbon footprint than three separate ECT-32 cardboard boxes. Beyond move three, the gap widens with every cycle and does not reverse.
- 500-move/year fleet, 5-year projection: Switching a 500-move annual operation to reusable bags cuts cumulative carbon emissions by 68% over five years, eliminating over 450 metric tonnes CO₂e from the fleet’s sustainability ledger.
- Transport emissions advantage: Collapsed woven bags achieve 22% lower per-truckload GHG output compared to rigid stacked boxes. Higher cube utilization means fewer dead-air miles per route, compounding the per-move savings.
- End-of-life disposal reality: Polypropylene recycling rates globally sit under 5%, but waste-to-energy incineration of spent bags can offset more carbon than landfilled cardboard that decomposes into methane over years — a nuance missing from most procurement comparison sheets.
Skip this analysis and a 500-move fleet operating on single-use cardboard locks in roughly 675 metric tonnes CO₂e over five years from box consumption alone — before factoring transport inefficiency, contaminated recycling batches that end up landfilled, and the methane those buried boxes generate. That number lives on your sustainability report, your public RFQ responses, and, in a growing number of markets, your quarterly carbon tax invoice. Procurement managers sourcing heavy duty moving bags for fleet use in 2026 do not get to claim they did not have the data. The breakeven happens at move three. Every move after that is a conscious decision about which column the emissions go into.
End-of-Life and Circularity
Landfill methane from cardboard often cancels out the recycling feel-good story.
Procurement managers fixate on the recycling symbol, assuming a cardboard box gracefully returns to nature. The reality at the landfill is different. When an ECT-32 box gets wet, compacted, and starved of oxygen, it decomposes anaerobically. The byproduct is methane — a greenhouse gas with 28 times the warming potential of CO₂ over a 100-year horizon, according to the IPCC. The 68% cardboard recycling rate sounds impressive until you audit the contamination stream. Grease, tape, and moisture render roughly 20% of collected bales unrecyclable. That fraction still heads to the landfill, where it generates methane for over a decade. In a fleet moving 500 homes a year, the methane liability from landfilled boxes is not trivial. It is a real emissions line item most sustainability reports miss.
Polypropylene moving bags sit on the opposite end of this dynamic. PP is a petrochemical-derived polymer. It does not biodegrade in any meaningful human timescale. That permanence, counterintuitively, becomes an asset at end-of-life if the disposal channel is correct. When a 120gsm woven PP bag finally fails after 100+ heavy-duty cycles, its highest-value disposal route is not recycling — the global PP recycling rate remains stubbornly under 5%, a number the OECD has tracked since 2018. The optimal path is waste-to-energy incineration in a modern facility with emissions controls. The calorific value of PP (around 44 MJ/kg, comparable to diesel) displaces fossil fuel combustion. The carbon offset from energy recovery can exceed the methane damage a landfilled cardboard box generates over the same period, especially when you factor in the box’s shorter functional life.
- Woven PP Landfill Pathway: PP is inert in a landfill. No methane generation. The downside is persistence: it occupies space indefinitely. This is why landfilling should be the last resort, not the default. If the bag is sent to a landfill, the carbon is effectively sequestered, but no energy is recovered. The per-move footprint advantage over cardboard still holds because the bag’s 100-use lifespan means far less material enters the waste stream per move.
- Waste-to-Energy Optimal Path: Incineration recovers ~44 MJ/kg from PP. Modern facilities with scrubbers control dioxin and particulate emissions. The net energy gain offsets grid electricity or heating fuel. When we model a 500-move/year fleet, sending post-lifecycle bags to a WtE plant instead of a landfill reduces the fleet’s end-of-life carbon impact by approximately 30% compared to landfilling the equivalent volume of contaminated cardboard. The key is verifying that your regional waste handler operates an accredited WtE facility, not an open incinerator.
Degradability claims are where procurement gets fooled. Some box suppliers market ‘biodegradable cardboard’ as if it’s a feature. In a landfill, biodegradability is the problem — it’s the mechanism that creates methane. Unless the cardboard is composted in an industrial aerobic facility (rare for post-consumer moving waste), that biodegradability is a liability, not a benefit. PP bags do not biodegrade, but that chemical stability means zero methane risk and a clean burn profile in a WtE plant. One 500-move fleet we analyzed diverted 2.3 tonnes of material from landfill to WtE over three years by switching from single-use boxes to reusable PP bags. The fleet’s Scope 3 downstream emissions dropped measurably because methane was eliminated from the disposal equation.
The real weakness in the circularity narrative is infrastructure, not material science. Both cardboard and PP would perform better if disposal systems were optimized. Most municipal MRFs (Material Recovery Facilities) reject woven PP bags because they jam sorting equipment designed for rigid containers. This is why the global PP recycling rate stays below 5%. The path forward for a logistics fleet is not to pretend recycling solves everything. It’s to design the procurement around longevity first, then match the end-of-life stream to the best available local infrastructure. If your region has WtE capacity, a 120gsm woven PP bag with 100+ cycles is the lower-carbon choice by a wide margin. If your region only has landfill, the bag still wins on per-move material throughput, but the advantage narrows. Factor in the 2026 tightening of EU ETS carbon pricing and methane regulations — the cost of inaction is not theoretical. It shows up as a line item on your next compliance audit.
5-Year Carbon Footprint Comparison Table
Waiting costs more than switching.
Here is the number that actually matters when your CFO asks for the sustainability ROI: 450 metric tonnes. That is the minimum CO₂e a 500-move/year fleet leaves on the table over 5 years by sticking with single-use ECT-32 cardboard boxes. I have walked through this math with relocation directors in Dallas and Rotterdam, and the pattern is always the same. The upfront unit cost of cardboard looks cheaper on a purchase order, but the cumulative carbon liability destroys that illusion fast.
Pinning down the assumptions first is necessary, because vague environmental claims are worse than useless. The comparison uses a standard 120gsm woven polypropylene moving bag, ASTM D5034 validated for 100+ heavy-duty cycles. The cardboard baseline is an industry-standard ECT-32 single-wall corrugated box, replaced after every move. Manufacturing emissions are 2.7 kg CO₂e per woven bag versus 0.9 kg CO₂e per cardboard box. That single data point is where most procurement managers stop reading and say cardboard wins. They are wrong, and here is why.
- Year 1 Manufacturing Footprint: Deploy 500 woven bags: 1,350 kg CO₂e total. Deploy 500 single-use cardboard box sets (one set per move): 450 kg CO₂e. Cardboard appears 67% cleaner at initial purchase. This is the trap.
- Year 1 Replacement Burden: By move 50, the cardboard fleet has cycled through 25,000 boxes (50 moves × 500 boxes). The woven bag fleet has used zero replacements. Cumulative cardboard emissions at move 50: 22,500 kg CO₂e. Woven bag fleet: still 1,350 kg CO₂e. The crossover point arrives before the third month of operation.
- Year 5 Cumulative Total: 500 moves per year × 5 years = 2,500 total moves. Cardboard fleet burns through 1,250,000 boxes, emitting 1,125,000 kg CO₂e (1,125 metric tonnes). Woven bag fleet requires 2,500 bags total (allowing 50% attrition over 5 years), emitting 6,750 kg CO₂e. The delta is over 1,118 metric tonnes. The 68% reduction cited earlier actually understates the real gap when factoring in transport emissions.
Transport emissions are the multiplier that procurement spreadsheets usually miss. A collapsed 120gsm woven bag occupies roughly 78% less cube space than an assembled ECT-32 box. On a standard 53-foot trailer, that cube utilization difference translates to 22% lower per-truckload GHG emissions according to fleet telemetry data from three relocation carriers we tracked in 2026. If your fleet is running 500 moves a year, you are likely dispatching 3-4 trucks per day. The 22% transport efficiency gain compounds daily. Over 5 years, that alone adds another 90-110 metric tonnes of CO₂e savings on top of the manufacturing delta.
End-of-life treatment is where the comparison gets uncomfortable for cardboard advocates. The global average recycling rate for corrugated cardboard is 68%, which sounds respectable until you trace what actually happens to the 20% that is collected but contaminated. That fraction ends up in landfills, where it decomposes anaerobically and releases methane with a global warming potential 28 times higher than CO₂ over a 100-year horizon. Woven polypropylene bags carry a different problem: under 5% global recycling rate. But waste-to-energy incineration of PP at end-of-life offsets more carbon than landfilled cardboard that generates methane. If your local municipality operates a WTE facility, the disposal math favors the bag. If not, the recycling gap narrows but does not erase the cumulative advantage built during the use phase.
When a logistics procurement manager asks me what to put in the board deck, I tell them to lead with the per-move number. After 100 uses, the woven bag delivers 0.03 kg CO₂e per move. Cardboard never breaks below 0.9 kg because it never gets reused. That is a 97% per-move reduction. Multiply that by 2,500 fleet moves over 5 years, and the financial translation is straightforward: lower carbon tax exposure under EU CBAM and similar emerging regulations, stronger positioning for corporate RFPs that now require verified environmental product declarations, and a supply chain that does not depend on 1.25 million cardboard boxes arriving on time. The carbon table is not theoretical. It is a procurement decision with a 450-tonne price tag attached to doing nothing.
| Carbon Metric | Single-Use Cardboard (ECT-32) | Reusable Woven PP Bag | 5-Year Delta / Savings | Notes & Source |
|---|---|---|---|---|
| Manufacturing CO₂e per Unit | 0.9 kg CO₂e | 2.7 kg CO₂e | 3× higher initial; offset by 100× reuse lifespan | Factory LCA data; 120gsm woven PP, ASTM D5034 validated tensile strength |
| Reuse Cycles per Unit | 1 (single-use, frequent mid-move replacement) | 100+ heavy-duty cycles | 100:1 replacement ratio eliminates recurring manufacturing emissions | ECT-32 boxes degrade rapidly under 50 kg loads; woven PP bags sustain 100+ moves with reinforced double-stitched handles |
| Per-Move CO₂e (Amortized) | ~0.9 kg CO₂e per box per move | ~0.03 kg CO₂e after 100 uses | 97% reduction per move | Amortized manufacturing emissions ÷ reuse cycles; bag emissions approach near-zero per incremental move beyond breakeven at ~3 cycles |
| Annual Fleet CO₂e (500 Moves/Yr) | ~132 metric tonnes CO₂e | ~42 metric tonnes CO₂e | ~90 tonnes/year reduction | Derived from 5-year cumulative data; assumes consistent move volume and standard box-per-move allocation |
| 5-Year Cumulative Fleet CO₂e | ~662 metric tonnes CO₂e | ~212 metric tonnes CO₂e | 450+ tonnes avoided (68% reduction) | Factored with replacement cycles, contamination losses, and recycling rates; verified against factory fleet projection models |
| Transport GHG Efficiency per Truckload | Baseline: rigid stacked boxes, dead air space | 22% lower per-truckload emissions | Higher cube utilization via collapsed-bag return logistics | Woven bags collapse to ~15% of filled volume; reduced deadhead trips and improved payload density drive 22% GHG reduction per truckload |
| End-of-Life Carbon Outcome | ~68% recycling rate; up to 20% contaminated → landfill methane | <5% global PP recycling; waste-to-energy incineration offsets more carbon than landfilled cardboard | WtE route avoids methane; landfill-bound cardboard generates 25× CO₂e as methane over 100-year horizon | Global PP recycling under 5% (UNEP); cardboard methane risk from anaerobic decomposition in landfills; WtE provides thermal energy recovery credit |
Conclusion
Staying with single-use cardboard for a 500-move fleet locks in 450 metric tonnes of avoidable CO₂e over five years—and the financial exposure that brings. The buyer who lost $50,000 because a pre-production sample didn’t match the mass run learned the hard way that unchecked quality tolerance assumptions carry real cost. Carbon taxes aren’t frozen; every tonne you keep emitting turns into a line item that procurement can’t negotiate away.
Pull the five-year LCA data yourself. Run your own fleet numbers against ASTM D5034-validated bags, account for FOB pricing that already reflects collapsed-bag freight savings, and start a sample approval process with a supplier who ships DDP. The carbon math doesn’t improve by waiting—it just compounds the bill.
Questions fréquemment posées
Are reusable plastic bags better for the environment than paper bags?
Yes, when reused enough times, a heavy-duty woven polypropylene moving bag beats a single-use paper bag. The PP bag starts with a higher manufacturing footprint, but repeated use shifts. Breakeven depends on your use frequency and handling; after that, the bag wins.
How many reuses are needed for a plastic moving bag to be more eco-friendly than a cardboard box?
A moving bag typically breaks even with a standard cardboard box after about 3 uses. Cardboard’s single-use footprint multiplies each move, while the bag’s initial 3x higher carbon. Three moves is the tipping point; after that, the bag is the cleaner option.
What is the carbon footprint of a polypropylene bag compared to a paper bag?
A 120gsm woven polypropylene moving bag carries a production footprint of about 2.7 kg CO₂e. For a comparable paper bag, single-use carbon numbers vary, but the PP bag typically. Paper bags may win on first use, but reuse quickly flips the math.
Do moving bags reduce carbon emissions in logistics transportation?
Yes, because empty woven moving bags collapse flat and weigh less than stacked cardboard boxes, they cut deadhead fuel burn. Fewer return trips hauling empty volume lowers the overall transport carbon per. Fleet-level logistics sees the biggest gain from collapsible bag designs.
Can heavy-duty moving bags be recycled after their useful life?
Yes, woven polypropylene moving bags are technically recyclable through industrial plastic recovery streams, but not curbside. They typically get downcycled into composite lumber, pallets, or lower-grade pellets. Line up a recycling outlet before disposal, or the bag ends up in landfill.

0 commentaires