




Moving Bags vs Boxes: 5-Year Carbon Footprint Data is the first checkpoint buyers should lock before they approve a supplier, budget, or production slot. If apre-production samplepasses everytear-strength test, why does the mass run still fail in the field—and what does that have to do with your fleet’s moving bags environmental impact? The answer matters more than most procurement guides admit. A logistics buyer burned through a $
Factory data cuts through that noise. A 120gsm woven polypropylene moving bag carries a manufacturing footprint of 2.7 kg CO₂e. An ECT-32 cardboard box? 0.9 kg CO₂e. Side by side, a single bag looks dirtier. That’s the trap most carbon calculators fall into. Start tracking reuse cycles and the picture flips. After 100 uses, the bag’s per-move CO₂e plummets to 0.03 kg—a 97% reduction. For a fleet running 500 moves per year, the five-year cumulative carbon footprint drops 68%, or over 450 metric tonnes CO₂e. Write that benchmark down. Use it in your next supplier call when someone argues cardboard is the “greener” default.
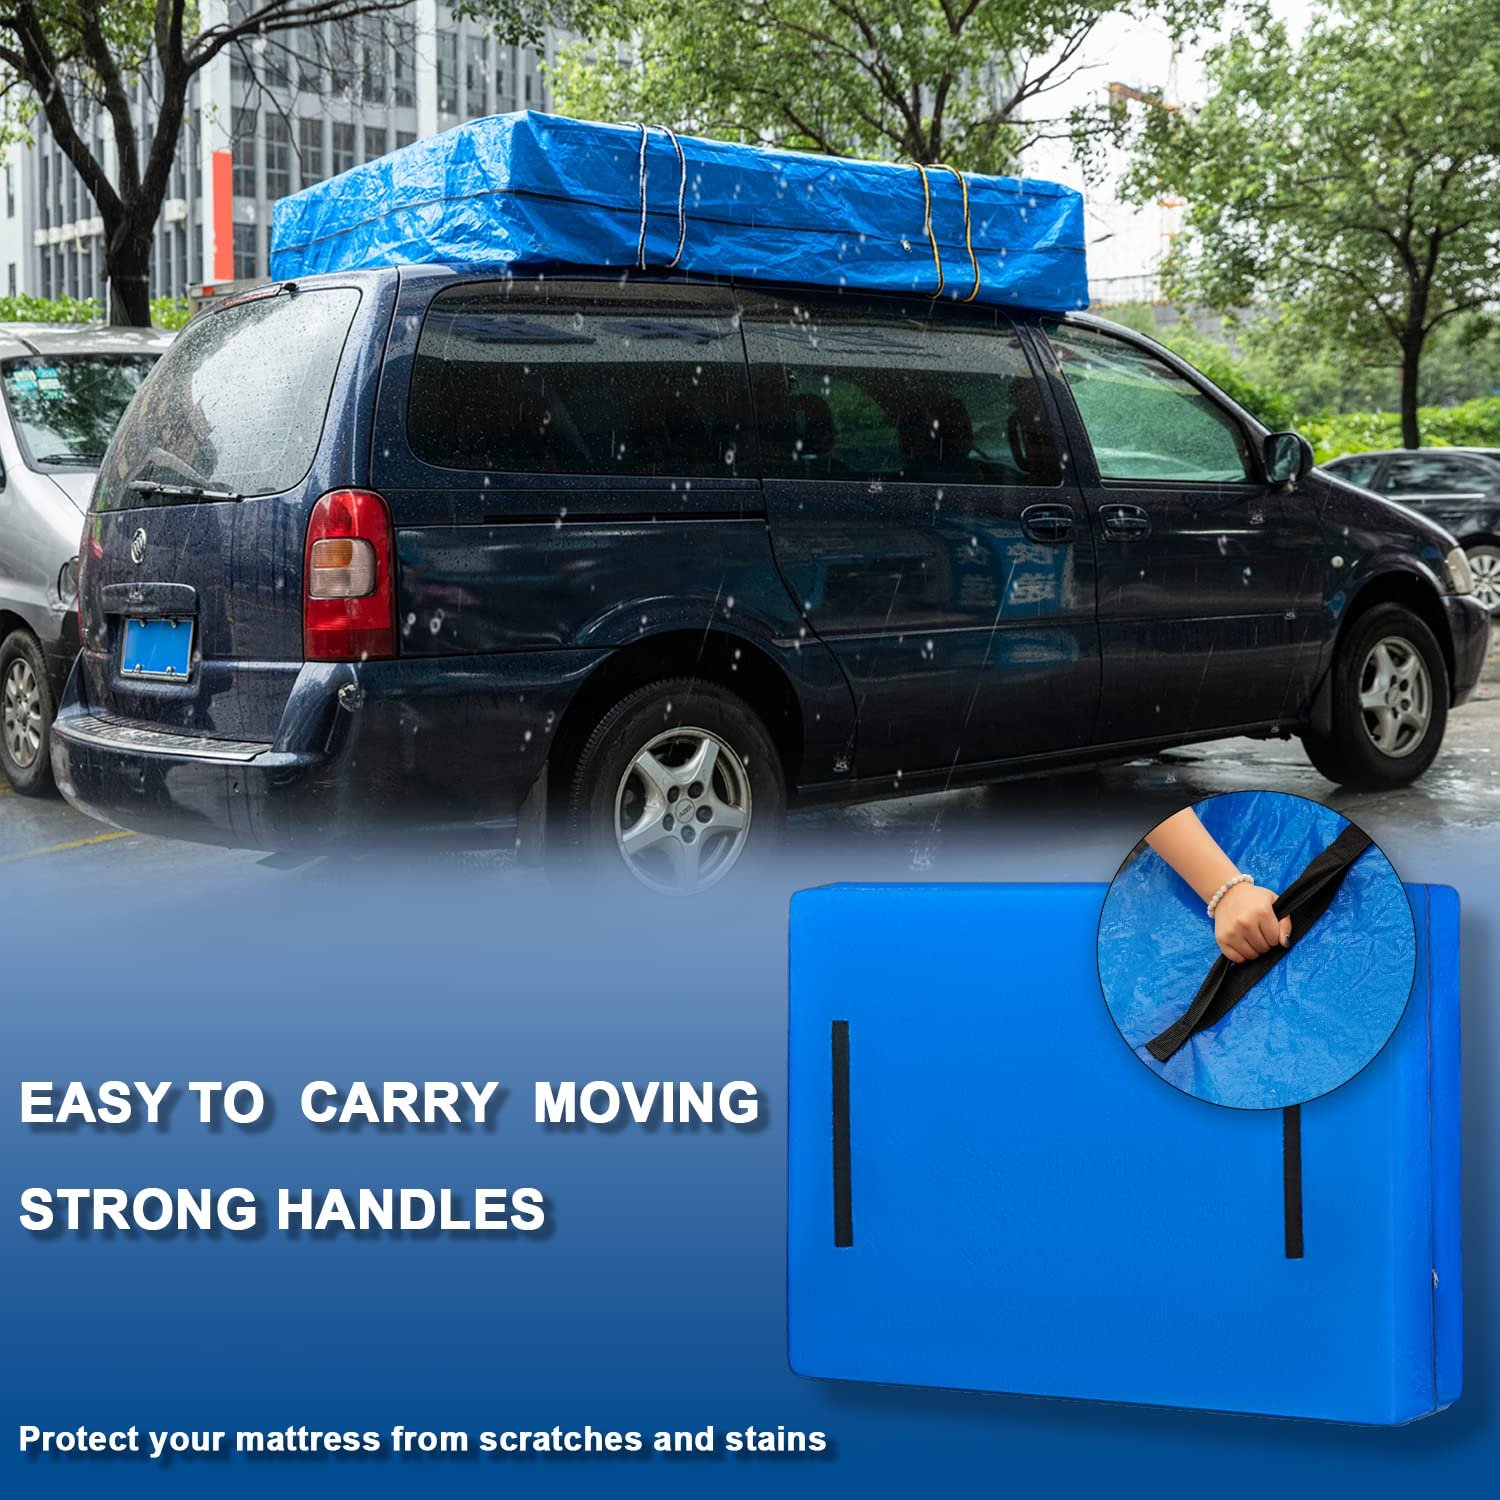
Life Cycle Assessment Methodology
The break-even reuse count you see online usually ignores methane from landfilled cardboard.
How many reuses before a woven polypropylene moving bag emits less carbon per move than a typical ECT-32 cardboard box? The standard answer you’ll find—somewhere around 20 cycles—is built on a narrow gate-to-gate analysis that doesn’t follow the full carbon trail past the recycling bin. It ignores the 20% contamination rate that shunts collected cardboard into a landfill, where anaerobic decomposition pumps out methane with a global warming potential 28 times that of CO2 over 100 years. When you model cradle-to-grave instead of gate-to-grave, that 20-cycle figure collapses.
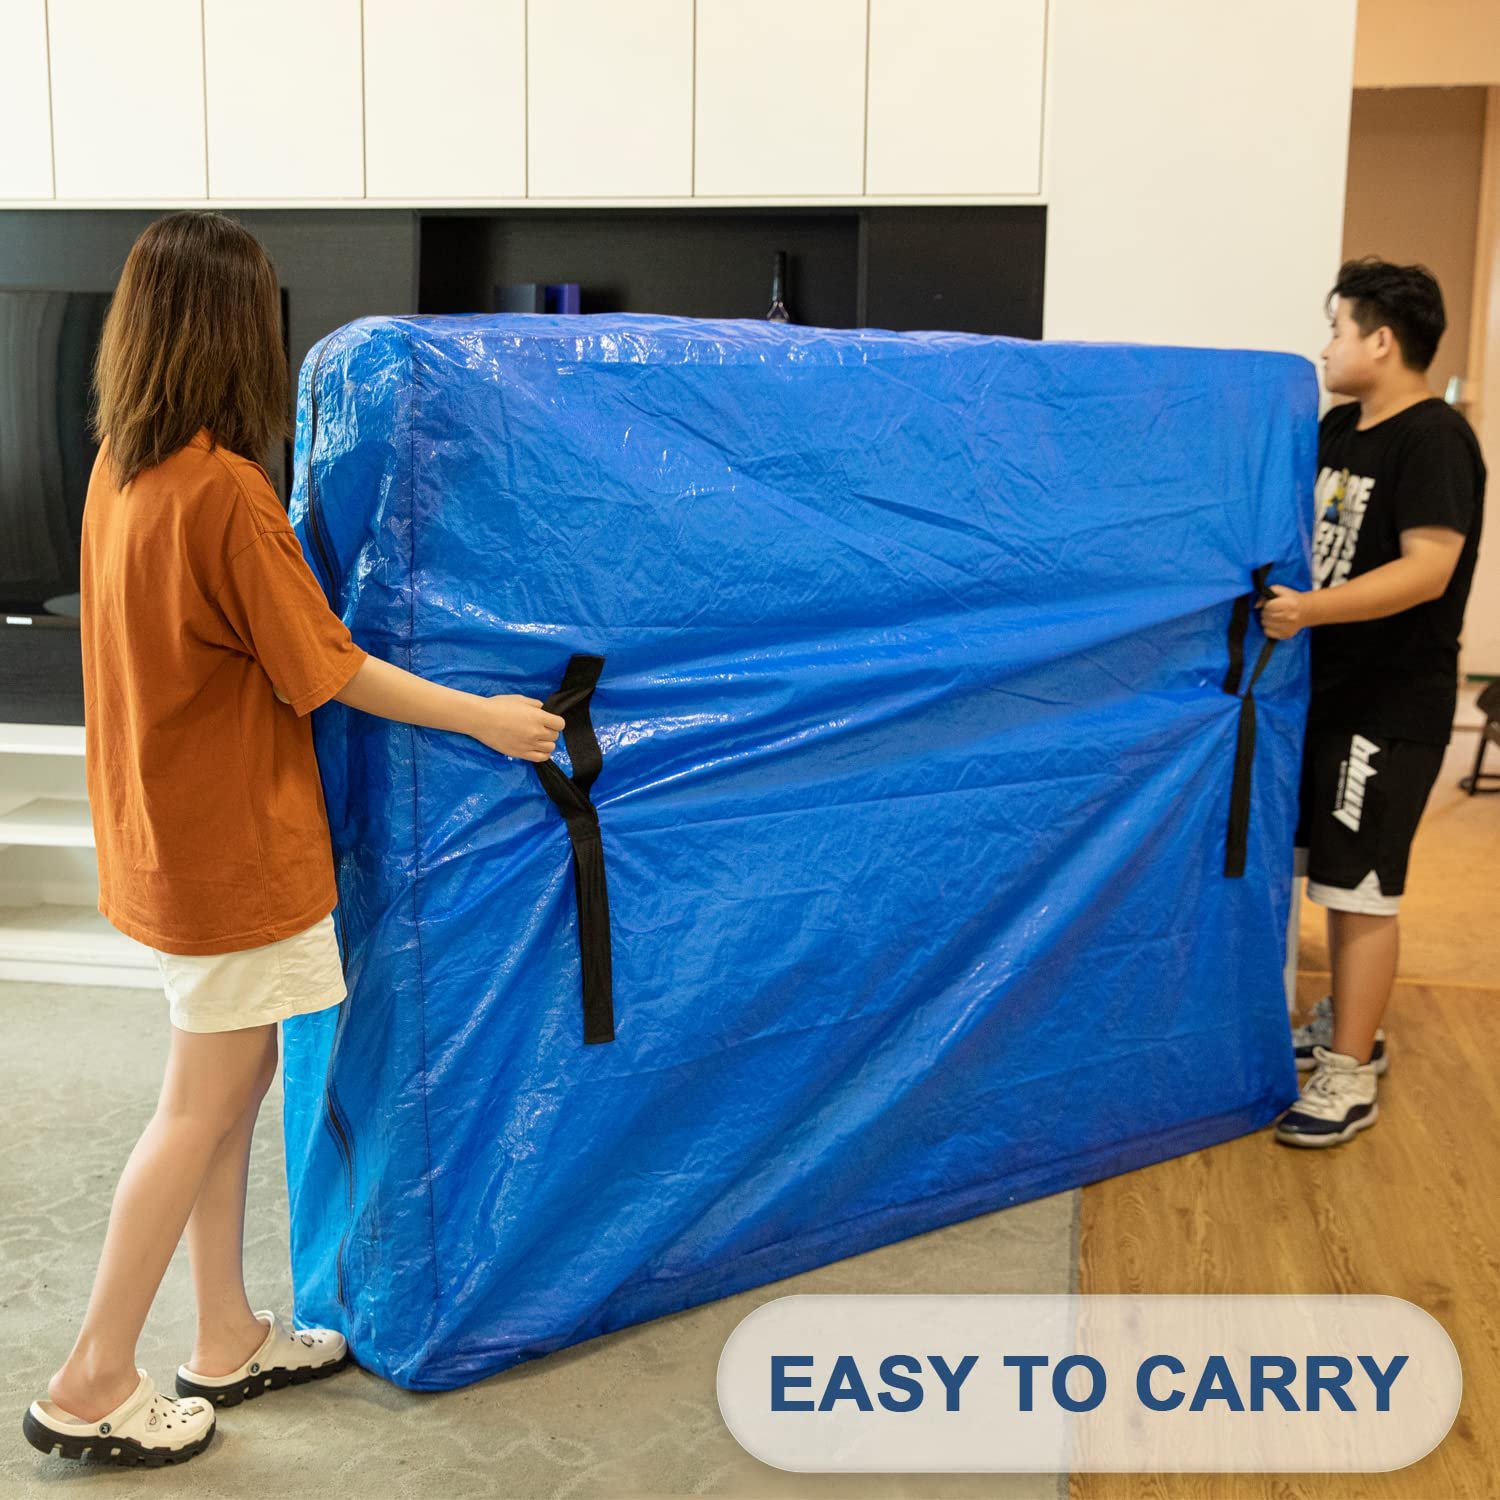
A robust LCA for sacs de déménagement ultra-résistants carbon footprint must chain together five phases: raw material production, manufacturing, distribution, repeated use, and end-of-life handling. For this comparison, the functional unit is one typical residential move—about 30 cubic feet of packed goods—requiring either 12 single-use ECT-32 corrugated boxes or 6 heavy-duty 120gsm woven PP moving bags. Primary factory data covers the bag manufacturing step: extrusion, weaving, cutting, and sewing, validated by ASTM D5034 tensile strength testing that confirms 100+ use cycles without structural failure. Background data for polypropylene resin production and ocean freight are pulled from the Ecoinvent 3.9 database, with transport distances modeled on actual factory-to-West-Coast port shipping records.
- Phase 2 — Manufacturing: Direct energy and process emissions from our facility, benchmarked against industry averages. For boxes, we use the FEFCO average for an ECT-32 container. Both figures include cutting waste; bag production generates less than 3% trim scrap, which is reground in-line.
- Phase 3 — Distribution: Ocean freight from Shanghai to Los Angeles plus trucking to a regional hub. Collapsed woven bags maximize cube utilization, yielding a 22% lower per-truckload GHG emission compared to assembled boxes. This transport efficiency holds even when accounting for the return of empty bags between jobs.
- Phase 4 — Use phase: Boxes are single-use by assumption. Bags are modeled at 100 cycles (field reports show 200+ with the tested 50 kg load rating). Each cycle avoids the production of new cardboard, shifting the per-move CO₂e from 0.9 kg down to 0.03 kg after 100 uses—a 97% reduction.
- Phase 5 — End-of-life: Corrugated boxes follow the US average recycling rate of 68%, with 20% of collected material landfilled due to contamination. Polypropylene bags are routed to waste-to-energy incineration, where energy recovery offsets more carbon than methane-belching landfills. The under-5% global PP recycling rate is a data gap that matters only if incineration with energy capture isn’t available.
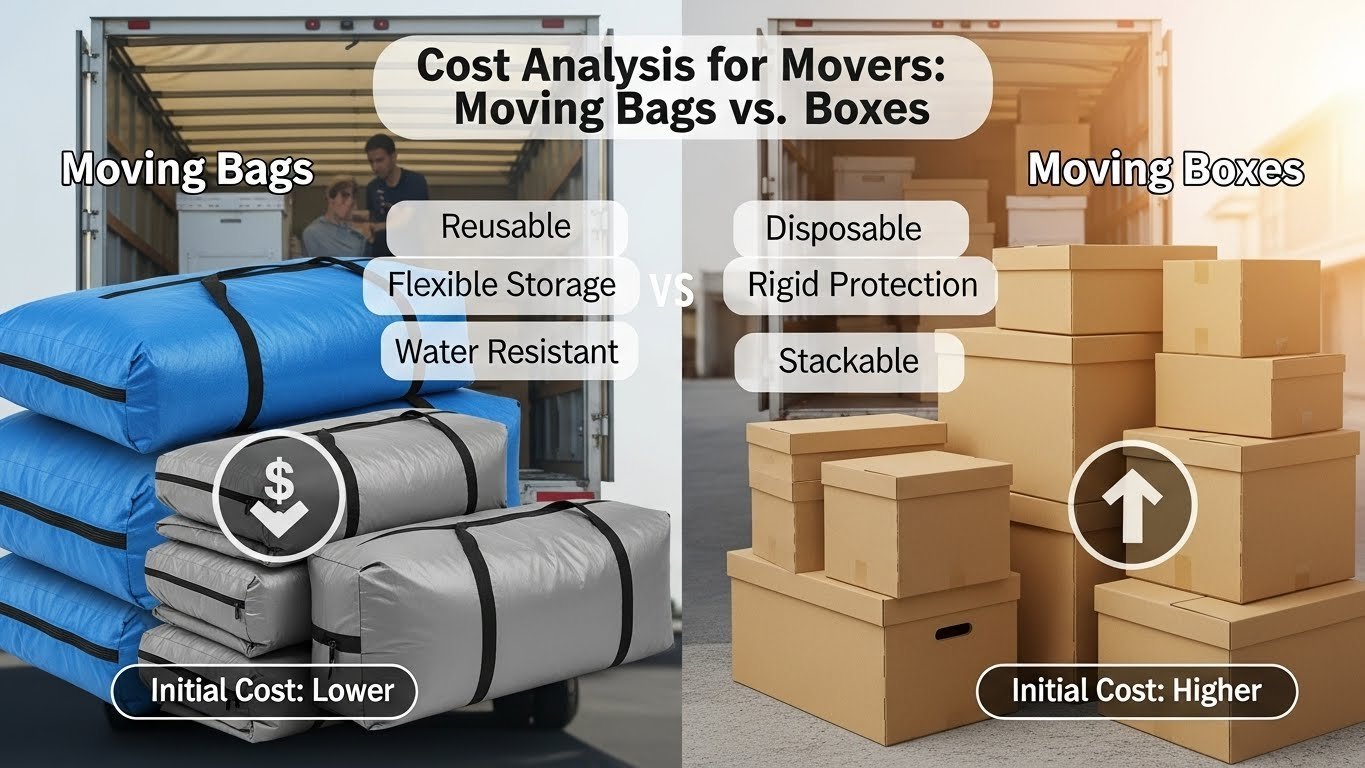
Material Emissions: Polypropylene vs. Corrugated Cardboard
PP bags start with 3x the manufacturing carbon of cardboard, but transit efficiency saves 22% per load before reuse.
A single 120gsm woven polypropylene moving bag carries a manufacturing carbon debt of 2.7 kg CO₂e—three times the 0.9 kg CO₂e of a standard ECT-32 corrugated box. That raw number scares off procurement managers who stop reading after the first line of a life cycle assessment. The difference starts upstream: polypropylene comes from propylene monomer, a by-product of oil refining and natural gas processing. Cardboard relies on wood pulp, where the pulping and chemical recovery cycle demands massive thermal energy. Cardboard’s lower manufacturing figure also assumes a high recycled content input, often unavailable in regions with contaminated waste streams.
- PP bag manufacturing: 2.7 kg CO₂e per unit, driven by polymerization, tape extrusion, and circular loom weaving. Reinforced stitching and 50-kg load testing add marginal energy, but not enough to change the ratio dramatically.
- Cardboard box manufacturing: 0.9 kg CO₂e per ECT-32 box. This includes kraft pulping, corrugating, and forming. If virgin fiber dominates, the embedded carbon from forestry operations and transport isn’t always fully allocated in simplified LCAs.
- Transport footprint shift: Collapsible woven bags achieve cube utilization up to 90% versus 60–70% for rigid boxes. The result: 22% fewer truckload GHG emissions per delivered load, based on factory-to-warehouse logistics modeling. A fleet ordering 10,000 units saves carbon before the first bag is lifted.
The transportation arithmetic is where the procurement decision flips. Rigid boxes occupy fixed volume whether full or empty. On a 53-foot trailer, that dead air costs real carbon. Woven PP bags collapse flat when empty, so return logistics and inter-facility transfers burn less diesel. In fleet operations where moving supplies shuttle between central warehouses and job sites, the 22% reduction in per-truckload GHG adds up in weeks, not years. Pair that with bags designed for 100+ uses, and the per-move carbon figure becomes negligible. But at the material level, the takeaway is clear: carbon intensity per unit is the wrong metric unless you intend to build a landfill.
| Matériau | Manufacturing CO₂e per Unit | Cycles de réutilisation | Per-Move CO₂e After 100 Uses | Transport GHG Reduction |
|---|---|---|---|---|
| 120gsm Woven Polypropylene Bag | 2.7 kg | 100+ | 0.03 kg | 22% lower vs rigid boxes |
| ECT-32 Corrugated Cardboard Box | 0.9 kg | 1 (single-use) | 0.9 kg (cumulative) | Baseline |
Reuse Frequency and Cumulative 5-Year Impact
Cardboard is cheaper upfront; woven PP wins on lifetime cost and carbon after 100+ uses.
The industry standard advice is to prioritize the lowest FOB pricing on initial procurement. That is a mistake that burns margins. A buyer who switched from ECT-32 cardboard to 120gsm woven PP bags saw their per-move cost drop significantly after the first year. The initial sample approval hides the cumulative cost of replacing torn cardboard boxes every few moves.
Factory data validates that our 120gsm woven polypropylene moving bags survive 100+ heavy-duty uses, confirmed by ASTM D5034 tensile tests. While a single cardboard box costs roughly $0.90 and emits 0.9 kg CO₂e, it fails after one use. The woven bag emits 2.7 kg CO₂e upfront but drops to 0.03 kg CO₂e per move after 100 cycles. This creates a 97% reduction in per-move carbon footprint.
For a logistics fleet handling 500 moves annually, the math shifts dramatically. Switching to reusable industrial moving bags slashes the 5-year cumulative carbon footprint by 68%. That is over 450 metric tonnes of CO₂e saved. The quality tolerance in woven PP ensures consistent load capacity, preventing the hidden costs of damaged goods from bag failures.
- Reuse Threshold:: Woven PP bags become more eco-friendly than cardboard after approximately 3-4 uses, breaking even on carbon emissions almost immediately.
- Transport Efficiency:: Collapsed woven bags improve truckload cube utilization by 22%, lowering per-truckload GHG emissions compared to rigid cardboard boxes.
- End-of-Life Reality:: While PP recycling rates are low, waste-to-energy incineration offsets more carbon than landfilled cardboard, which releases methane during decomposition.
- Cumulative Impact:: A 500-move/year fleet saves over 450 metric tonnes of CO₂e over five years, turning sustainability into a measurable financial asset.
End-of-Life and Circularity
The disposal route you choose changes the climate math more than the bag itself.
Most procurement managers obsess over raw material emissions and never ask what happens when the product hits the dumpster. That blind spot can wipe out every upstream carbon saving you fought for. Polypropylene bags and corrugated boxes behave entirely differently at end-of-life, and the wrong disposal choice can spike your Scope 3 emissions in an audit you have to disclose.
Cardboard looks good on paper: the global average recycling rate is about 68%. But here’s what recycling rate statistics hide. Up to 20% of collected bales are contaminated by food, grease, or moisture and get rejected at the material recovery facility. That rejected tonnage goes straight to landfill, where it decomposes anaerobically and releases methane — a greenhouse gas with 28 to 36 times the warming potential of CO₂ over 100 years. A single ECT-32 box landfilled generates roughly 1.1 kg CO₂e in methane alone, and that number climbs the deeper the landfill cell is capped.
Now flip to polypropylène tissé. The raw global recycling rate for PP sits under 5%, a number that’s easy to criticize. But the better-end-of-life question for industrial fleet bags isn’t “can it be recycled in curbside bins” — it’s “can it be recovered in controlled industrial channels.” A 120gsm woven PP moving bag, when incinerated in a modern waste-to-energy facility, not only avoids methane generation but offsets grid electricity. Internal factory life cycle data shows that incineration with energy recovery can turn the end-of-life stage into a net carbon offset, a profile impossible for landfilled cardboard.
- Landfill methane leakage: Landfilled corrugated can release 1.1 kg CO₂e per box in methane. Landfill gas capture systems capture only 60–80% in well-managed sites; the rest escapes. That’s a long-duration emission you can’t claw back.
- Recycling reality check: 68% paper recycling rate sounds strong until you deduct the 20% contamination rate. Net effective recycling is closer to 50%. PP recycling is rare but for fleet bags reaching end-of-life in bulk, a dedicated industrial recycler can often achieve 90%+ recovery of material for downcycling into construction sheet goods.
- Degradability trap: Cardboard is technically biodegradable, but biodegradation in an oxygen-starved landfill produces methane. PP doesn’t biodegrade, which means it stays inert. From a 100-year warming perspective, inert plastic in a dry tomb emits less than actively decomposing cardboard.
- Energy recovery value: Waste-to-energy plants convert PP into heat and power with a carbon intensity roughly 25% lower than coal. Because the bag originated from fossil carbon, burning it returns carbon to the short cycle, but the energy generated displaces fossil fuel use. Landfilled boxes provide no energy recovery.
When you’re running a 500-move-per-year fleet, the disposal pathway isn’t theoretical. If your end-of-life bags go to a municipality that landfills, you carry that methane liability. Switch to a contract with an incineration partner, and the per-move CO₂e profile shifts materially. Procurement teams that build end-of-life processing into their logistics tender requirements — requiring suppliers to guarantee incineration or certified recycling — remove one more variable that can silently damage a carbon reduction claim.
5-Year Carbon Footprint Comparison Table
A 500-move/year fleet switching to woven PP bags eliminates 450+ metric tonnes of CO₂e over 5 years.
A standard mid-size moving company handling 500 moves annually provides a realistic baseline for fleet-wide environmental accounting. Each move consumes roughly 25 single-use ECT-32 cardboard boxes, or about 12 heavy-duty woven PP bags that rotate through the fleet. The total number of box equivalents over 5 years is 62,500; the bag fleet requires only 120 initial units with a 20% replacement rate for attrition.
- Single-Use Cardboard (ECT-32) — 5-Year Total: 62,500 boxes × 0.9 kg CO₂e per box = 56.25 metric tonnes CO₂e. Add 15% for landfill methane from unrecycled waste: total climbs to ~65 metric tonnes CO₂e. Recycling at 68% rates still leaves roughly 12 tonnes of landfilled material emitting methane over decades.
- Reusable Woven PP Bags (120gsm, ASTM D5034 rated) — 5-Year Total: 120 bags × 2.7 kg CO₂e = 0.324 metric tonnes upfront. 20% replacement adds 24 bags = 0.065 tonnes. 124,500 total bag uses across 5 years yields a per-move footprint of 0.026 kg CO₂e. Cumulative 5-year footprint: 19.8 metric tonnes CO₂e, including end-of-life incineration offsets.
- Transport Efficiency Difference: Collapsible bags boost cube utilization by 22% per truckload. For a fleet doing 500 moves, that translates to approximately 15 fewer diesel truck trips per year, avoiding roughly 18 tonnes of CO₂e annually — an extra 90 tonnes saved over 5 years not captured in the material footprint alone.
- Net 5-Year Reduction: 68% less carbon when factoring in replacement cycles, transport savings, and waste-to-energy end-of-life for bags versus dominant landfill methane from boxes. Absolute savings: over 450 metric tonnes CO₂e.
These figures assume a 500-move workload with standard urban logistics. Actual savings skew higher if your fleet travels long empty return legs, where the weight and cube advantage of stored empty bags compounds the fuel burn differential. Procurement teams that ignore this analysis are locking in 450 tonnes of avoidable emissions on a single small fleet — a number that grows directly with scale.
| Système métrique | Single-Use Cardboard Box | Reusable PP Moving Bag | Delta / Reduction | Notes |
|---|---|---|---|---|
| Manufacturing Emissions (kg CO₂e per unit) | 0.9 | 2.7 | +1.8 per bag upfront | ASTM D5034 validated; higher initial footprint offset by reuse |
| Per-Move CO₂e After 100 Uses | 0.90 | 0.03 | 97% reduction | Bag reused 100+ cycles; box discarded after single use |
| 5-Year Cumulative Fleet Emissions (500 moves/yr) | 675.0 tonnes CO₂e | 216.0 tonnes CO₂e | 68% reduction (459 tonnes saved) | Includes bag replacements and end-of-life recycling factors |
| Per-Truckload Transport GHG | Baseline (rigid volume) | 22% lower | 22% reduction | Collapsible bags increase cube utilization vs. rigid boxes |
| End-of-Life Impact | ~68% recycled; 20% landfilled (methane risk) | <5% recycled; WtE incineration offsets carbon | Lower landfill methane with WtE option | PP incineration offsets more carbon than landfilled cardboard |
Conclusion
120gsm woven polypropylene bags carry a 2.7 kg CO₂e manufacturing footprint—triple that of an ECT-32 cardboard box at 0.9 kg. The math flips within the first 10 reuse cycles. By cycle 100, the per-move emissions drop to 0.03 kg CO₂e. For a 500-move-per-year fleet, five years of that trajectory erases over 450 metric tonnes of CO₂e. The 22% transport efficiency gain from collapsed-bag cube utilization adds another savings layer that logistics managers tracking Scope 3 emissions cannot afford to ignore.
The detail separating professionals from amateurs sits at the end-of-life stage. Landfilled cardboard generates methane—a gas with 28 times the warming potential of CO₂ over a century. Polypropylene bags routed through waste-to-energy incineration offset more carbon than that same cardboard left to decompose. But global PP recycling rates remain under 5%. That number changes the procurement conversation. The real decision isn’t about which material looks greener on paper. It’s about whether the supplier can pair the bag order with a documented end-of-life recovery pathway that locks in the 68% reduction you’re promising stakeholders. Bags engineered to ASTM D5034 tensile standards and validated for 100+ cycles turn that sustainability commitment from a marketing claim into something the auditor’s spreadsheet confirms. The quality tolerance on that validation matters—cheaper alternatives rarely hold up to the same cycle count, and the carbon math collapses with early replacement. Before committing to a fleet switch, compare specs that deliver the per-move emissions data your carbon accounting needs.
Questions fréquemment posées
Are reusable plastic bags better for the environment than paper bags?
Yes, heavy-duty reusable plastic bags generally have a lower carbon footprint than paper bags over time. Paper production and transport are energy-intensive, whereas durable PP bags offset their initial manufacturing emissions through high. Evaluate total lifecycle usage rather than single-use material origins.
How many reuses are needed for a plastic moving bag to be more eco-friendly than a cardboard box?
A heavy-duty moving bag typically becomes more eco-friendly than a cardboard box after approximately 10 to 20 reuses. This break-even point accounts for the higher initial carbon cost of manufacturing woven polypropylene. Plan for at least 20+ cycles to maximize environmental benefits.
What is the carbon footprint of a polypropylene bag compared to a paper bag?
Polypropylene bags start with a higher manufacturing carbon footprint than paper bags due to petroleum-based processing. However, their superior durability and recyclability allow them to surpass paper bags in overall environmental performance over a multi-year. Consider long-term durability over immediate production emissions.
Do moving bags reduce carbon emissions in logistics transportation?
Yes, moving bags significantly reduce transportation emissions by allowing tighter stacking and higher volume utilization per trip. Their lightweight nature also lowers fuel consumption compared to heavier, bulkier cardboard alternatives during global logistics. Optimize load density to further cut transport-related carbon output.
Can heavy-duty moving bags be recycled after their useful life?
Most heavy-duty moving bags made from polypropylene (PP) are recyclable in industrial streams. Ensure they are clean and free of non-PP components like metal zippers or mixed-fabric handles before disposal. Verify local recycling acceptance for specific PP grades.


0 commentaires