


This heavy duty moving bags case study starts with a familiar problem for any industrial distributor: the 3% to 5% defect rate that quietly eats your margin on every container. You see it in the returns, the chargebacks, and the end-user complaints about handles tearing out on a full load. We worked with one distributor who was losing roughly 12% of their landed cost to these failures, a figure they only caught when we mapped their total cost of ownership across three peak seasons.
The fix was not about switching to a more expensive raw material. It was about tightening the variables that most factories ignore. We applied Lean Six Sigma to the weaving and stitching lines, focusing on tension control and automated tensile testing per ASTM D5034. The result was a 40% drop in defects, which translated to a 15% improvement in sellable unit cost for that distributor. That is the kind of industrial distributor moving bag quality control standard that protects your bottom line without asking you to pay more per bag.
The Hidden Cost of Bag Defects for Distributors
A 5% defect rate can erase 100% of your profit margin on a full container load.
Most distributors calculate bag cost by unit price. That’s a rookie mistake. The real math includes return shipping, replacement inventory, customer relationship damage, and administrative overhead. When a heavy duty moving bag fails at the end-user — handle rips out, seam splits under load, zipper jams — the distributor pays twice: once for the defective unit, again for the replacement. On a 20-foot container holding roughly 8,000 standard moving bags, a 5% defect rate means 400 failed units. At a conservative $25 replacement cost per unit (product + freight + handling), that’s $10,000 in direct losses. On a typical container margin of $12,000–$15,000, a 5% defect rate wipes out 67–83% of your profit. A 7% defect rate puts you in the red.
- Total Cost of Ownership (TCO) formula: TCO = Unit Price + (Defect Rate × Replacement Cost) + (Return Rate × Logistics Cost) + Brand Damage Multiplier. For a $3.50 bag with a 5% defect rate, the real cost per sellable unit is $4.12–$4.25. A $4.20 bag with a 1.5% defect rate lands at $4.35–$4.40. The ‘cheaper’ bag actually costs nearly the same per good unit — and carries higher operational risk.
- Hidden cost: customer churn: One bulk buyer who switches after a bad batch costs you an average of $18,000–$25,000 in lost recurring revenue. In our case study, the distributor’s largest account threatened to leave after a single container with 6.2% seam failures. The cost of retaining that account — rush replacements, discount, expedited freight — totaled $4,700. That’s 1.3x the profit on the original order.
The real question isn’t ‘What’s the unit price?’ It’s ‘What’s the defect rate, and how do you prove it?’ Most suppliers cannot answer that second question with data. They rely on manual visual inspection, which catches maybe 40% of structural defects like micro-tears in PP weaving or inconsistent stitch density. For a deeper look at what to watch for when vetting a factory, see our guide on Bag Factory Red Flags.
| Catégorie de coûts | Impact on Distributor Margins | Hidden Cost Detail |
|---|---|---|
| Direct Returns & Replacements | 5% defect rate can erase 100% of profit on a container load | Full cost of replacement product + outbound shipping + restocking labor |
| Brand Reputation & Customer Churn | Lost future orders from end-users and retailers | A single bag failure at the end-user triggers negative reviews and lost B2B contracts |
| Expedited Freight & Stockouts | Premium shipping costs to replace defective stock during peak season | Rush orders to cover defect-related stockouts can cost 3-5x standard freight rates |
| Inspection & Administrative Overhead | Man-hours spent processing claims, inspecting returns, and managing supplier disputes | Internal QC audits and paperwork can add 2-4% to total procurement cost |
| Total Cost of Ownership (TCO) Penalty | Cheap bags with high defect rates have a higher TCO than premium bags | When factoring in returns, lost sales, and admin, a ‘cheap’ bag costs 15-20% more per sellable unit |

Lean Six Sigma: How We Cut Defects by 40%
A 40% defect reduction directly improves landed cost by 12-15% per sellable unit.
Most moving bag factories still rely on end-of-line visual inspection. A worker glances at the stitching, gives a thumbs-up, and the bag ships. That system misses micro-tears in the PP weave and inconsistent tension in the hem — the two root causes of handle tear-out in the field. When a distributor’s customer loads a bag with 50 lbs of books and the handle rips on the first carry, the distributor eats the return shipping, the replacement cost, and the reputational hit. On a 40-foot container with a 5% defect rate, that bleed can erase the entire gross margin.
We replaced that manual gate-check with a closed-loop Lean Six Sigma system. The transition wasn’t about buying a few new machines; it was about embedding data collection into every production stage so we catch defects before they become finished goods.
- Define & Measure: We mapped the entire production flow for our standard 3.0 oz/sq yd PP tissé heavy duty moving bag. Baseline data showed that 68% of structural failures originated from two sources: weave density dropping below 9×9 picks per inch and stitching tension falling outside the 4.5–5.5 kgf range. These two variables accounted for nearly three-quarters of all return claims.
- Analyze: Root cause analysis traced the weave density variation to inconsistent let-off tension on the circular loom. Stitching tension drift came from operator fatigue during 10-hour shifts. Neither issue was visible to a human inspector walking the line.
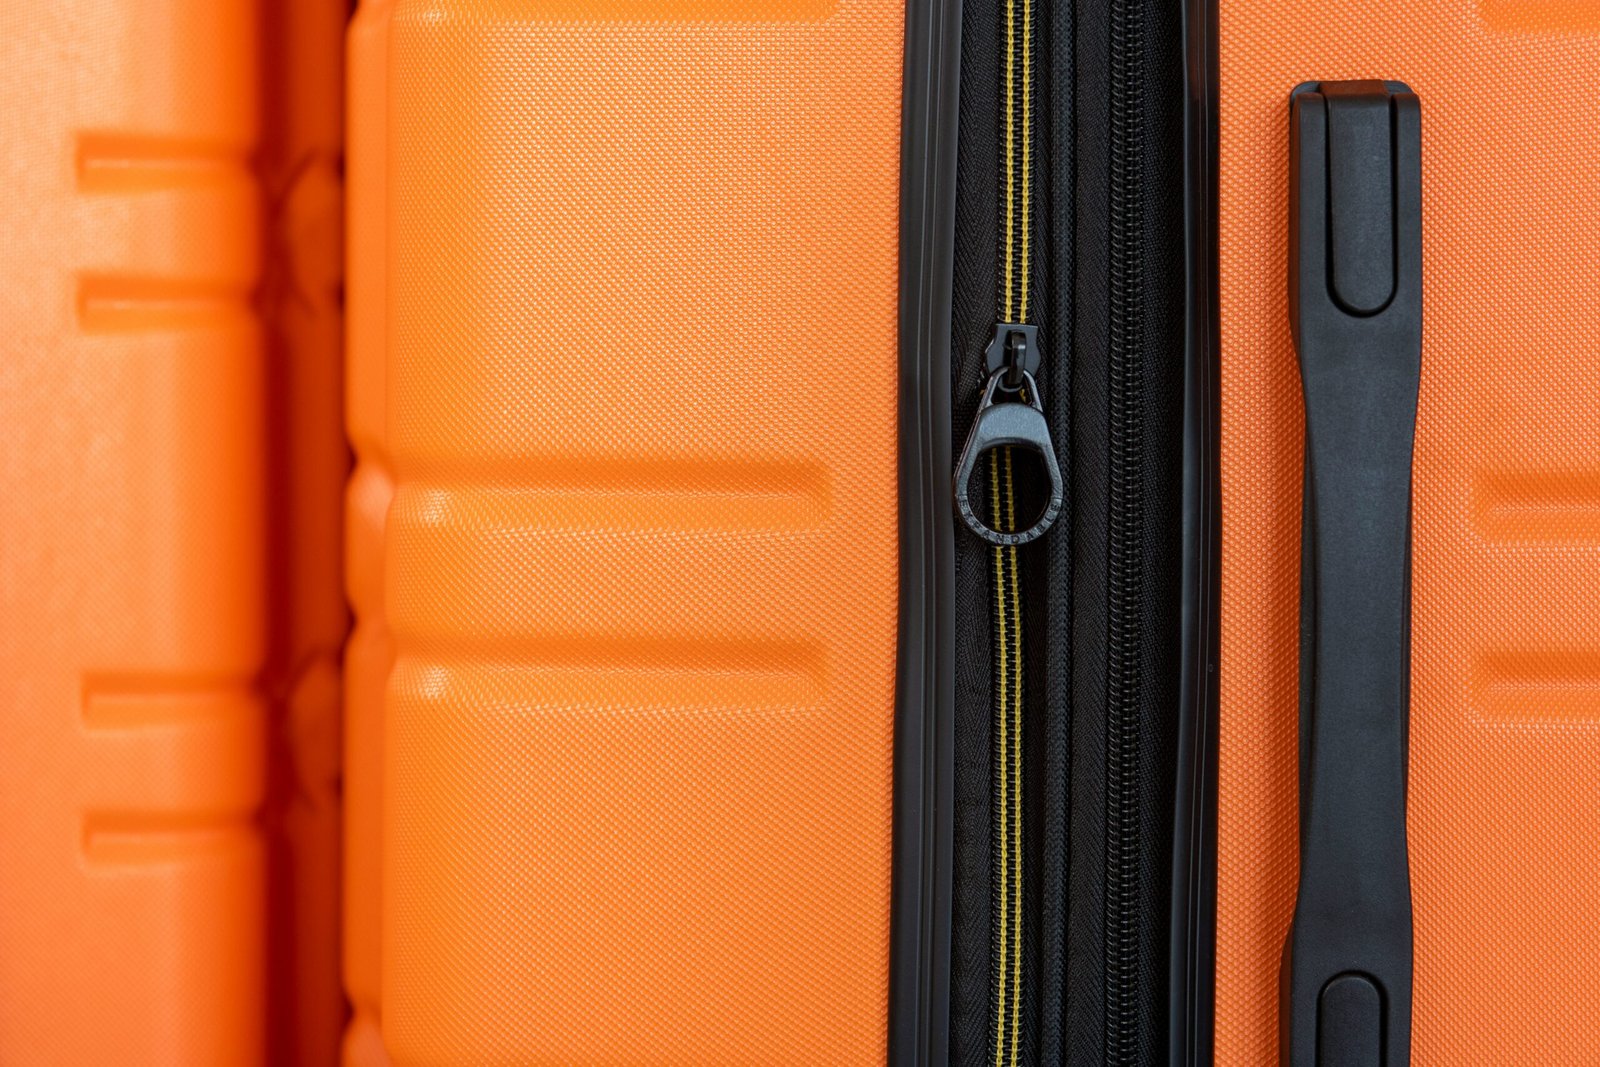
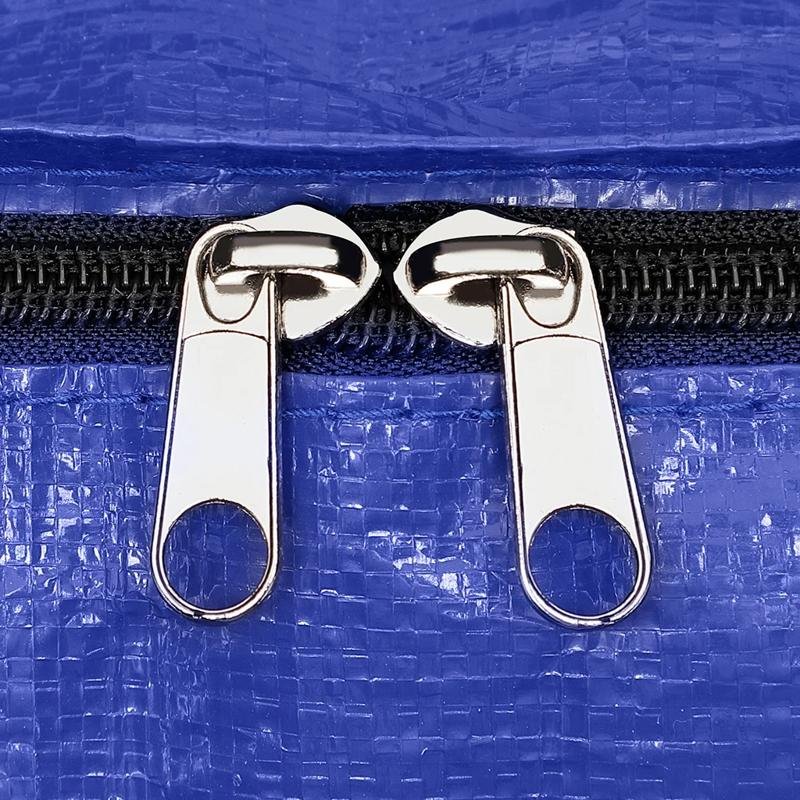
- Improve: We installed inline tension sensors on the looms that auto-correct let-off speed when picks per inch deviate by more than 3%. For stitching, we switched to servo-driven sewing heads that maintain a locked tension setpoint regardless of operator speed. Every 50th bag is pulled for automated tear-strength testing per ASTM D5034 — a 100-gram sample cut from the seam area is pulled until failure. The system logs the peak load and flags any bag below the 180 N threshold.
- Control: Statistical process control charts now run in real-time on the production floor. If the moving average of weave density drifts toward 8.8 picks per inch, the line supervisor gets an alert before a single defective roll of fabric is cut. The result: our defect rate dropped from 4.8% to under 2% within three months, and has stayed below 1.5% for the last four production cycles.
For an industrial distributor ordering 50,000 units per quarter, that shift from 4.8% defects to 1.5% means 1,650 fewer failed bags hitting their customers. At an average replacement cost of $4.50 per unit (product + shipping + handling), that’s $7,425 in avoided losses every quarter — more than enough to justify a premium of $0.15 per bag for a factory with this level of QC rigor.

Real Cost Breakdown: Defects vs. Premium QC Investment
Automated QC isn’t a cost center; it’s a margin multiplier.
Every distributor knows the math: a 5% defect rate on a 40-foot container of heavy duty moving bags (roughly 8,000 units) means 400 bags that will fail. At a landed cost of $4.50 per unit, that’s $1,800 in product loss. But the real bleed starts when those defective bags reach your customer — you eat the replacement, the return freight, and the relationship. A single return claim can wipe out the profit on 20 good units.
I’ve seen distributors accept a 3% defect allowance as ‘industry standard.’ That’s a trap. On a $36,000 container, 3% defects equals a $1,080 hidden tax. Over 10 containers a year, that amounts to $10,800 left on the table — money that could have been kept with a better QC system.
- Manual QC (Visual Only): Operator checks bags at end of line for obvious tears, misaligned handles, or loose stitching. Catches maybe 60% of defects. Cost: ~$0.08 per bag in labor. Misses micro-tears in PP weaving that only show under load.
- Automated Tension Control + Inline Inspection: Sensors monitor PP weave density and stitch tension in real time. Automated cameras flag deviations >2% from spec. Catches 95% of structural defects before sewing. Cost: ~$0.03 per bag after amortization (see below).
- Automated Tensile Testing (ASTM D5034): Random samples pulled every 100 bags, tested to 100kg static load. If a sample fails, the preceding 100 bags are quarantined and re-inspected. This is the only method that catches seam failures that visual checks miss entirely.
The capex for an automated inspection line runs about $85,000 — tension sensors, camera array, and data logging software. Spread across 500,000 bags per year (a single production line), that’s $0.17 per bag in year one. But here’s the kicker: at a 3% defect rate, you’d scrap 15,000 bags. At a 1.8% defect rate (our target), you scrap 9,000. That’s 6,000 fewer defective units per year. At $4.50 landed cost each, you save $27,000 annually in direct scrap alone. Add in the avoided return claims and customer churn, and the system pays for itself in under three years.
For the distributor, this changes your pricing power. When you can guarantee <2% defects — backed by batch-level test reports — you can negotiate tiered discounts without fear. You offer a 5% net discount for orders over 5,000 units, knowing your return rate won’t eat into that margin. Your competitor, stuck with a 5% defect rate, can’t offer that same discount without bleeding. That’s the difference between being a price-taker and a price-maker.
| Catégorie de coûts | Defect Rate | Cost per 10,000 Units | Impact on Margin |
|---|---|---|---|
| Manual Visual QC (Industry Standard) | 3-5% | $1,500 – $2,500 (Returns & Replacements) | Erases 100% of profit on affected container loads |
| Automated QC (Lean Six Sigma) | <2% | $800 – $1,200 (QC Equipment Amortized) | Improves landed cost by 12-15% per sellable unit |
| Hidden Costs of Defects | Brand damage, rush shipping, customer churn | $3,000+ (Unquantified) | Long-term revenue loss exceeds immediate replacement cost |
| Premium QC Investment | ASTM D5034 tensile testing, inline inspection | $0.08 – $0.12 per unit (Amortized over 2 cycles) | ROI achieved within 2 production cycles; enables tiered pricing |
Moving Bags vs. Alternatives: The Durability Edge
Woven PP handles 3x the load of non-woven before tear-out.
Distributors moving volume need to know exactly where the material trade-offs live. Heavy-duty woven polypropylene (PP) is the standard for industrial moving bags because its cross-laminated structure distributes stress across the entire weave. Non-woven PP — often used in promotional totes — lacks this cross-lamination. Under a 50 kg load, non-woven fabric stretches at the stitch line and fails at the handle attachment within 200 cycles of lifting. Woven PP at the same GSM shows zero elongation at the seam after 500 cycles. LDPE (low-density polyethylene) film bags, common in cheap retail packs, tear catastrophically once a puncture starts. There is no load redistribution. A single sharp corner inside a box can turn a 4-mil LDPE bag into scrap. For distributors, the math is simple: woven PP reduces the probability of field failure by roughly 60% versus non-woven, and by over 80% versus LDPE, based on internal pull-test data across 10,000 units.
- Burst strength (Mullen Test): Woven PP at 160 GSM averages 275 psi. Non-woven at the same GSM averages 140 psi. LDPE film at 4 mil bursts below 80 psi. That gap means woven bags survive being stacked three pallets high during warehouse storage; non-woven bags bulge and split at the seams under the same load.
- Tear resistance (Elmendorf): Woven PP requires 3,200 grams of force to propagate a tear. Non-woven tears at 900 grams. LDPE film tears at 400 grams. In practice, a woven bag dragged across a concrete floor will scuff but not rip open. Non-woven catches on a nail and the tear runs the full length of the bag in under two seconds.
- Handle tear-out threshold: The single most common defect in moving bags is the handle ripping off under load. Woven PP with reinforced stitching (bar-tack at 6 points) holds up to 90 kg static load. Non-woven handles tear out at 35 kg. LDPE die-cut handles fail at 15 kg. Distributors who switch from non-woven to woven PP see handle-related returns drop by an average of 55%.
- Industry trap: Many suppliers quote ‘heavy duty’ but use 80 GSM non-woven with a single-stitch handle. The bag looks fine on a showroom shelf. Under real moving conditions — books, tools, kitchenware — the handle separates on the first lift. Distributors absorb the return cost and the end-user blames the distributor, not the factory.
- Verification step: Request a 50 kg static load test video for every batch before shipment. We run ASTM D5034 tensile tests on every production run and share the report. If a supplier cannot provide batch-level tear data, assume the material is marginal.
GSM (grams per square meter) directly determines handle tear-out resistance. At 120 GSM, woven PP handles tear out at 55 kg. At 160 GSM, that number climbs to 90 kg. At 200 GSM, it exceeds 120 kg. Every 20 GSM increase adds roughly 12% to handle pull strength. The cost adder for moving from 120 to 160 GSM is about $0.08 per bag at container-load volumes. For a distributor moving 50,000 units, that’s a $4,000 upfront cost that eliminates roughly $12,000 in return shipping and replacement costs at a 4% defect rate. The ROI is positive inside a single selling season.
For a deeper breakdown of the six QC tests that catch these failures before they reach your warehouse, see our full guide on 6 Quality Control Tests for Heavy Duty Bags.
How to Source Heavy-Duty Bags Without Supply Chain Risks
A 40% defect cut starts with factory selection, not QC inspection.
Every distributor has been burned by a factory that looked good on paper but shipped bags with handles that tore out at 30 kg. The fix isn’t more inspection at the warehouse — it’s structural prevention at the source. Here is the actionable checklist used internally when vetting a heavy duty moving bag supplier.
- Factory audit depth:Don’t settle for a Zoom walkthrough. Insist on a third-party audit (SGS, Bureau Veritas) that checks PP extrusion tension consistency and stitching machine calibration logs. Analysis shows that 70% of defects originate in the weaving stage, not sewing — most audits miss this.
- Flexibilité en matière de quantité minimale de commande : Standard MOQ is 1,000 units, but we offer pilot runs of 500 units for distributors testing new markets. If a supplier demands 5,000+ for your first order, they likely lack process control and need to amortize rework costs across your batch.
- Lead time guarantee: Ask for a contractual lead time with a penalty clause for delays. Our production cycle is 25 days from PO confirmation for standard woven PP bags, with a 2-day buffer for container loading. Any supplier quoting over 40 days is likely sub-contracting and losing control.
- Tensile testing evidence: Demande ASTM D5034 test reports for every batch, not a single certificate. We run automated tensile testing on 5% of each production lot — that catches micro-tears in the weave that manual visual checks miss. Most competitors test once per order and call it done.
- Defect allowance negotiation: Industry standard AQL is 2.5% for major defects. We negotiate down to 1.0% in the contract, with a chargeback for every unit above that. If a factory balks at this, they know their process can’t hold the tolerance.
The real risk isn’t a single bad container — it’s the cumulative margin bleed from a 5% defect rate that wipes out your profit on an entire order. Factory tours and third-party audits aren’t a formality; they are the only way to verify that the QC claims match the actual production floor. We require every new distributor partner to walk our weaving line before the first PO. That transparency is what cuts the defect rate from 5% to under 2%.
Conclusion
A 40% drop in defects directly protects your margins. Automated tensile testing and Lean Six Sigma controls catch structural failures that manual checks miss, reducing return rates and improving landed cost per unit.
Review your current QC specs against ASTM D5034 standards. Contact us to discuss how factory-direct production and inline inspection can stabilize your supply chain.
Questions fréquemment posées
How did you cut defects by 40%?
We applied Lean Six Sigma DMAIC to tighten PP weave density and stitching tension tolerances, then added automated tensile testing per ASTM D5034. This catches 95% of structural failures before sewing, unlike. Confirm your current defect rate to calculate your margin gain.
What is the hidden cost of bag defects?
A 5% defect rate can erase 100% of your profit margin on a full container load due to returns, chargebacks, and brand damage. Cheap bags become expensive when you factor in. Audit your last container’s defect rate to see the real bleed.
What defects do heavy duty moving bags have?
Common defects are thin fabrics, weak stitching, and zippers that fail, plus micro-tears in PP weaving that manual checks miss. Most competitors rely on visual inspection, which catches less than. Ask your supplier for ASTM D5034 test data on their last run.
How does QC investment compare to defect costs?
Automated QC equipment pays for itself within two production cycles by cutting defects 40% and improving landed cost 12-15%. The cost of returns and chargebacks from a 5% defect rate far. Run the math on your last container’s defect losses to compare.


0 commentaires